From SDK to incident, automatically.
Install the SDK and ship. Errorgap captures and groups errors, correlates them with uptime, latency, and deploy signals, then assembles the evidence into an incident you can investigate.
Drop in the SDK
One package per runtime. Initialize with your project key and the SDK starts capturing — no manual try/catch plumbing required.
We catch, group, dedupe
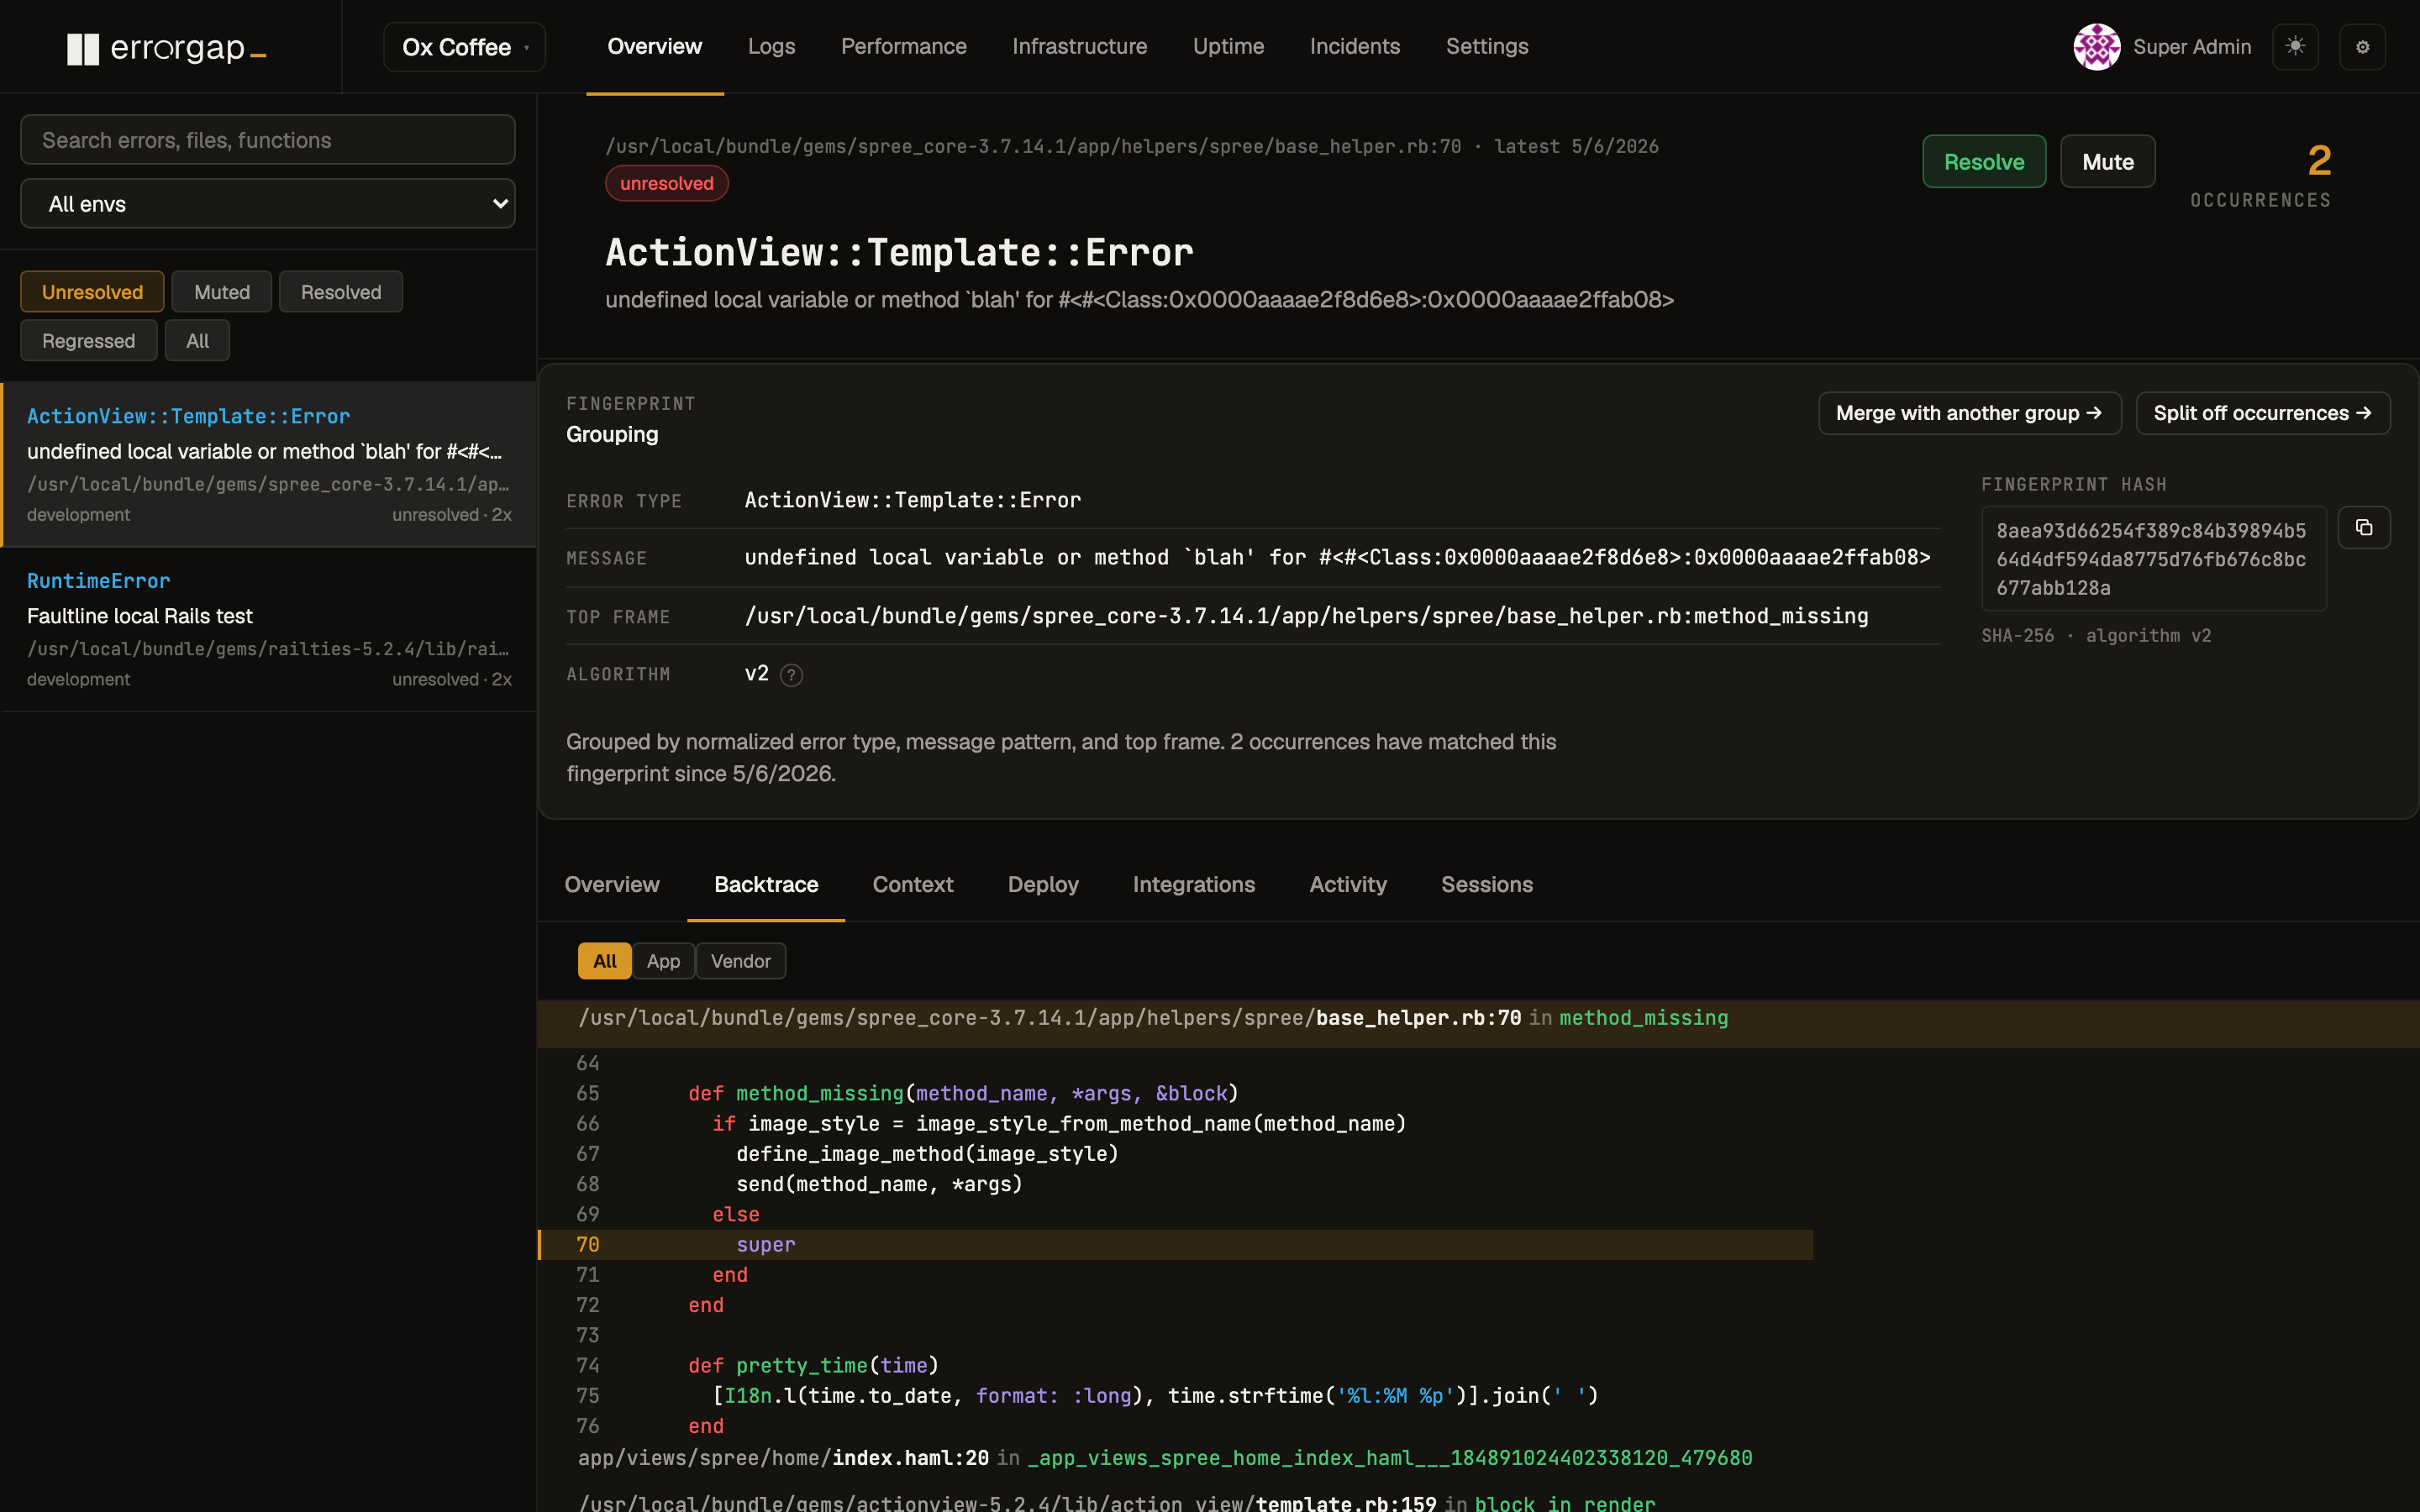
Exceptions are fingerprinted by stack signature and message — thousands of occurrences of one bug collapse into a single group with a count and a graph.
Signals become an incident
A heuristic engine promotes elevated error rates, uptime failures, latency spikes, and deploy correlations into a first-class Incident.
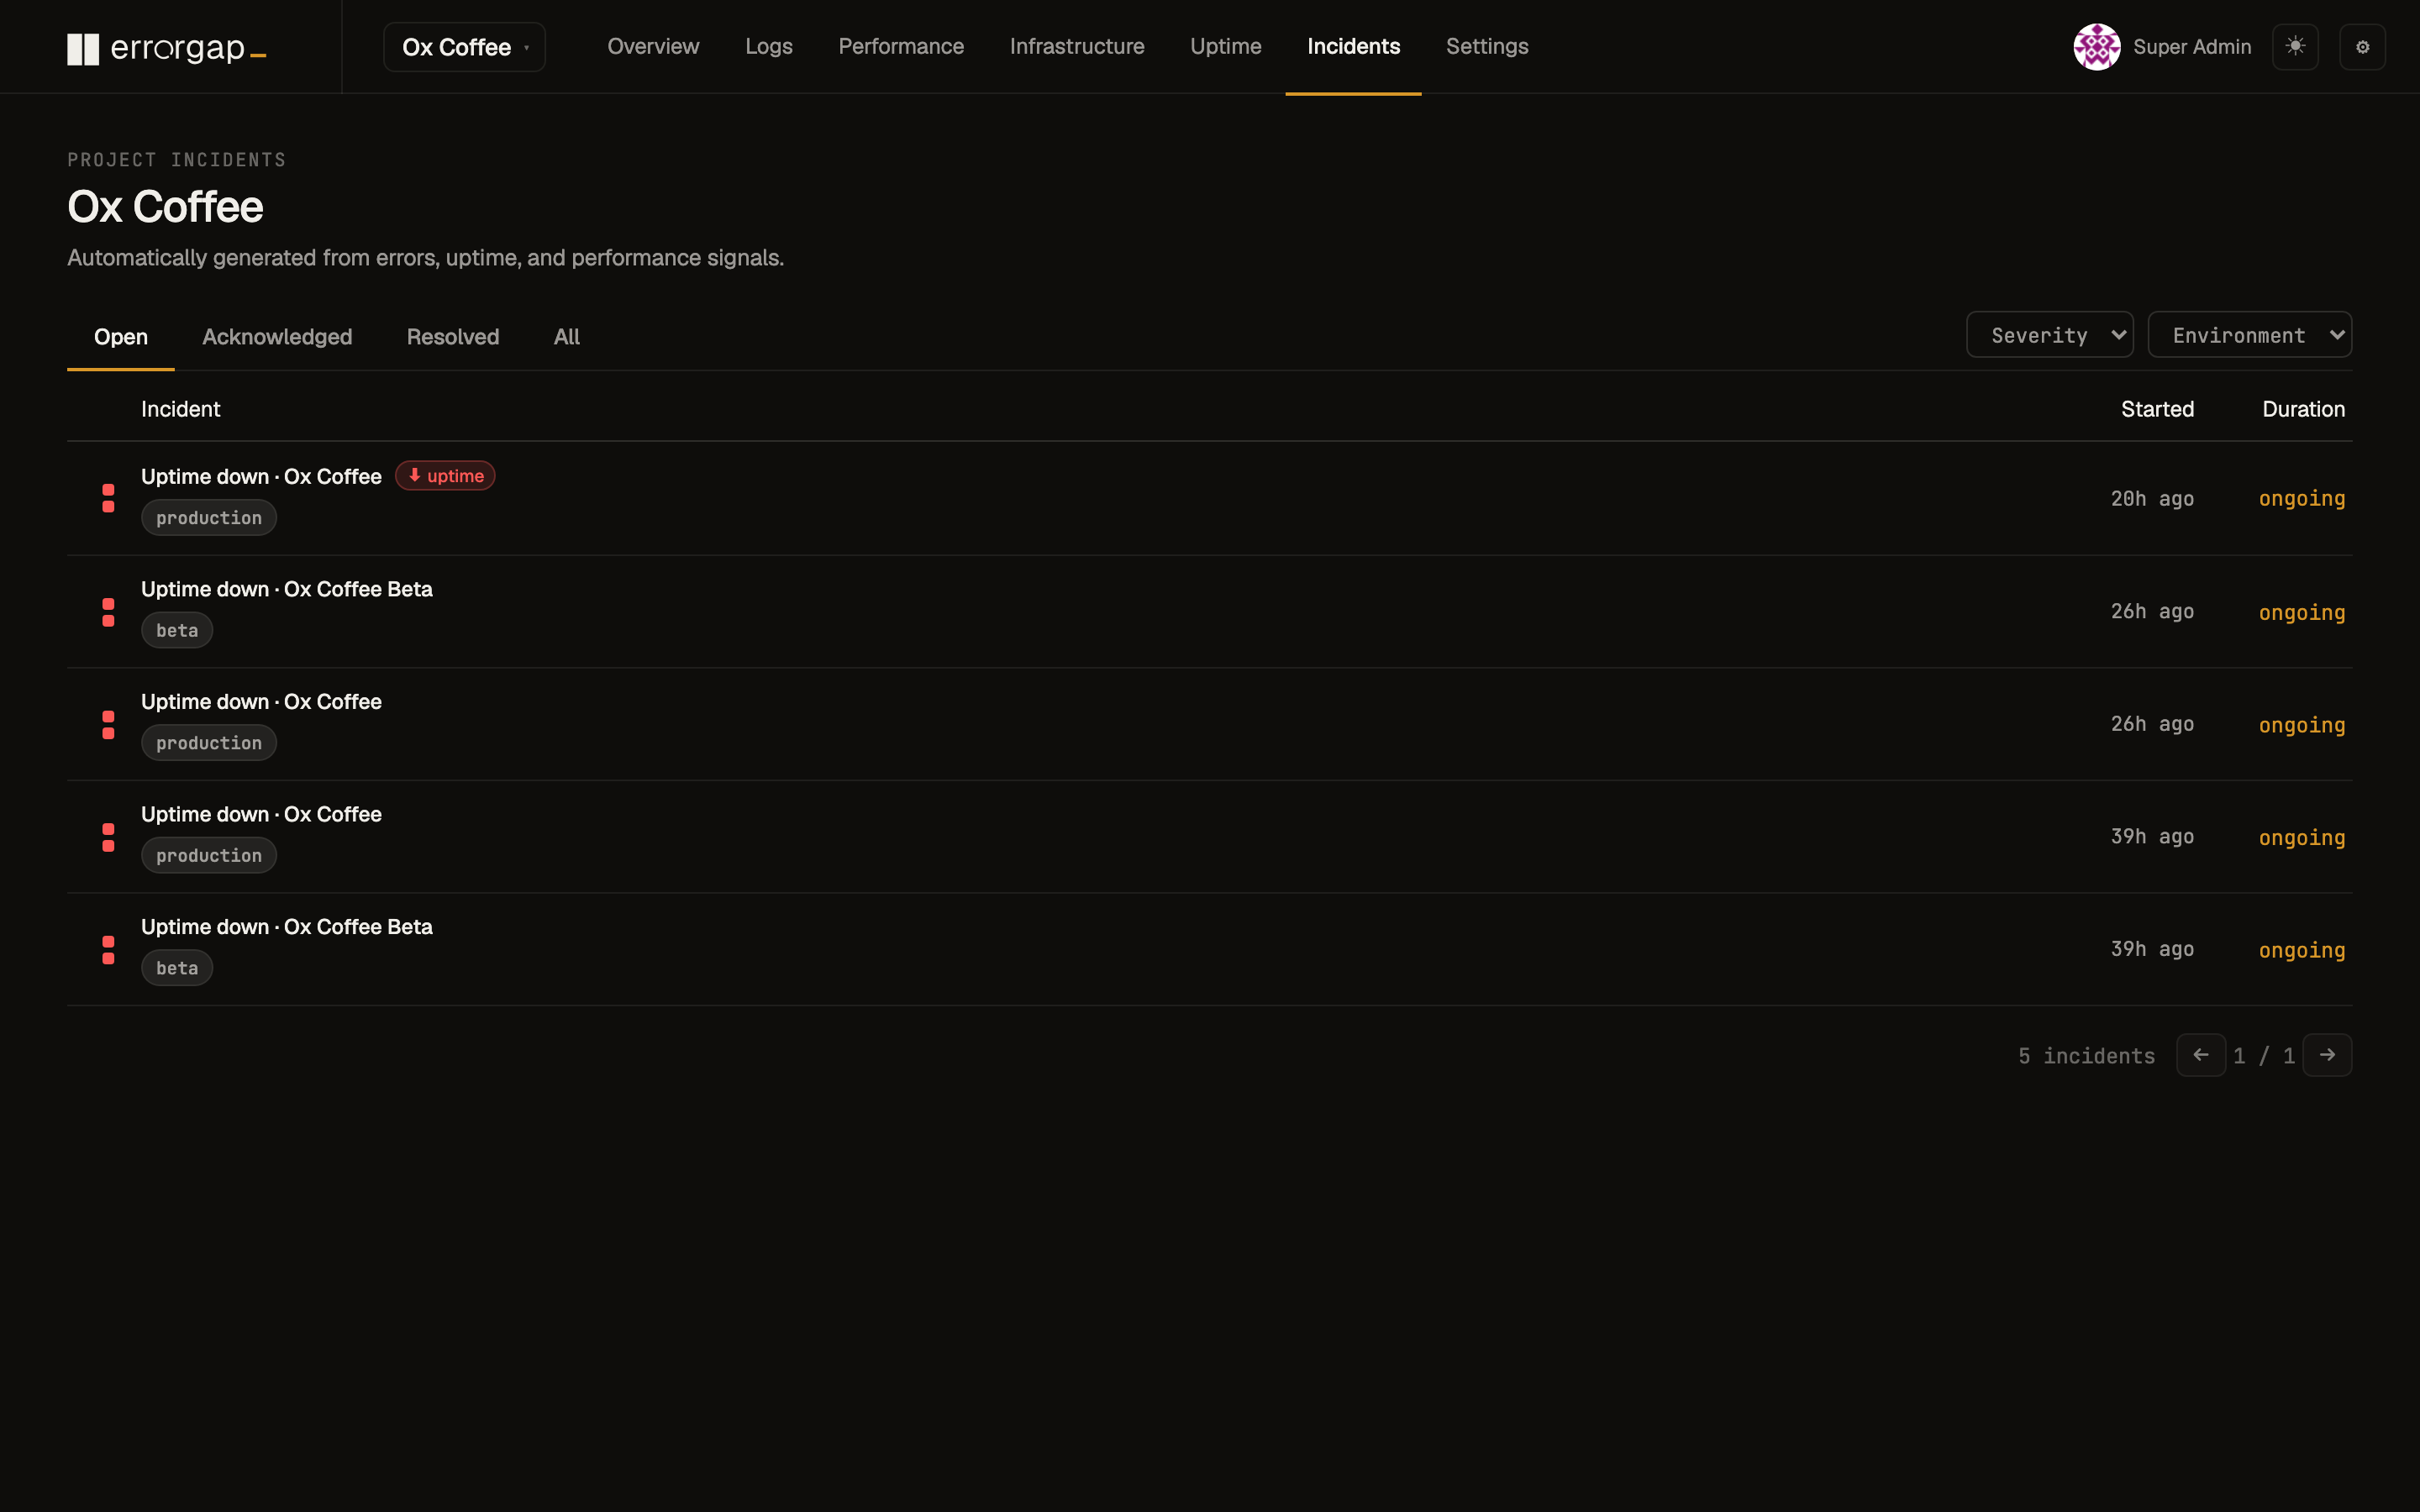
Likely cause, in one place
A deterministic likely-cause panel, a confidence score, an evidence timeline, and an optional AI summary — everything to act, without tab-hopping.
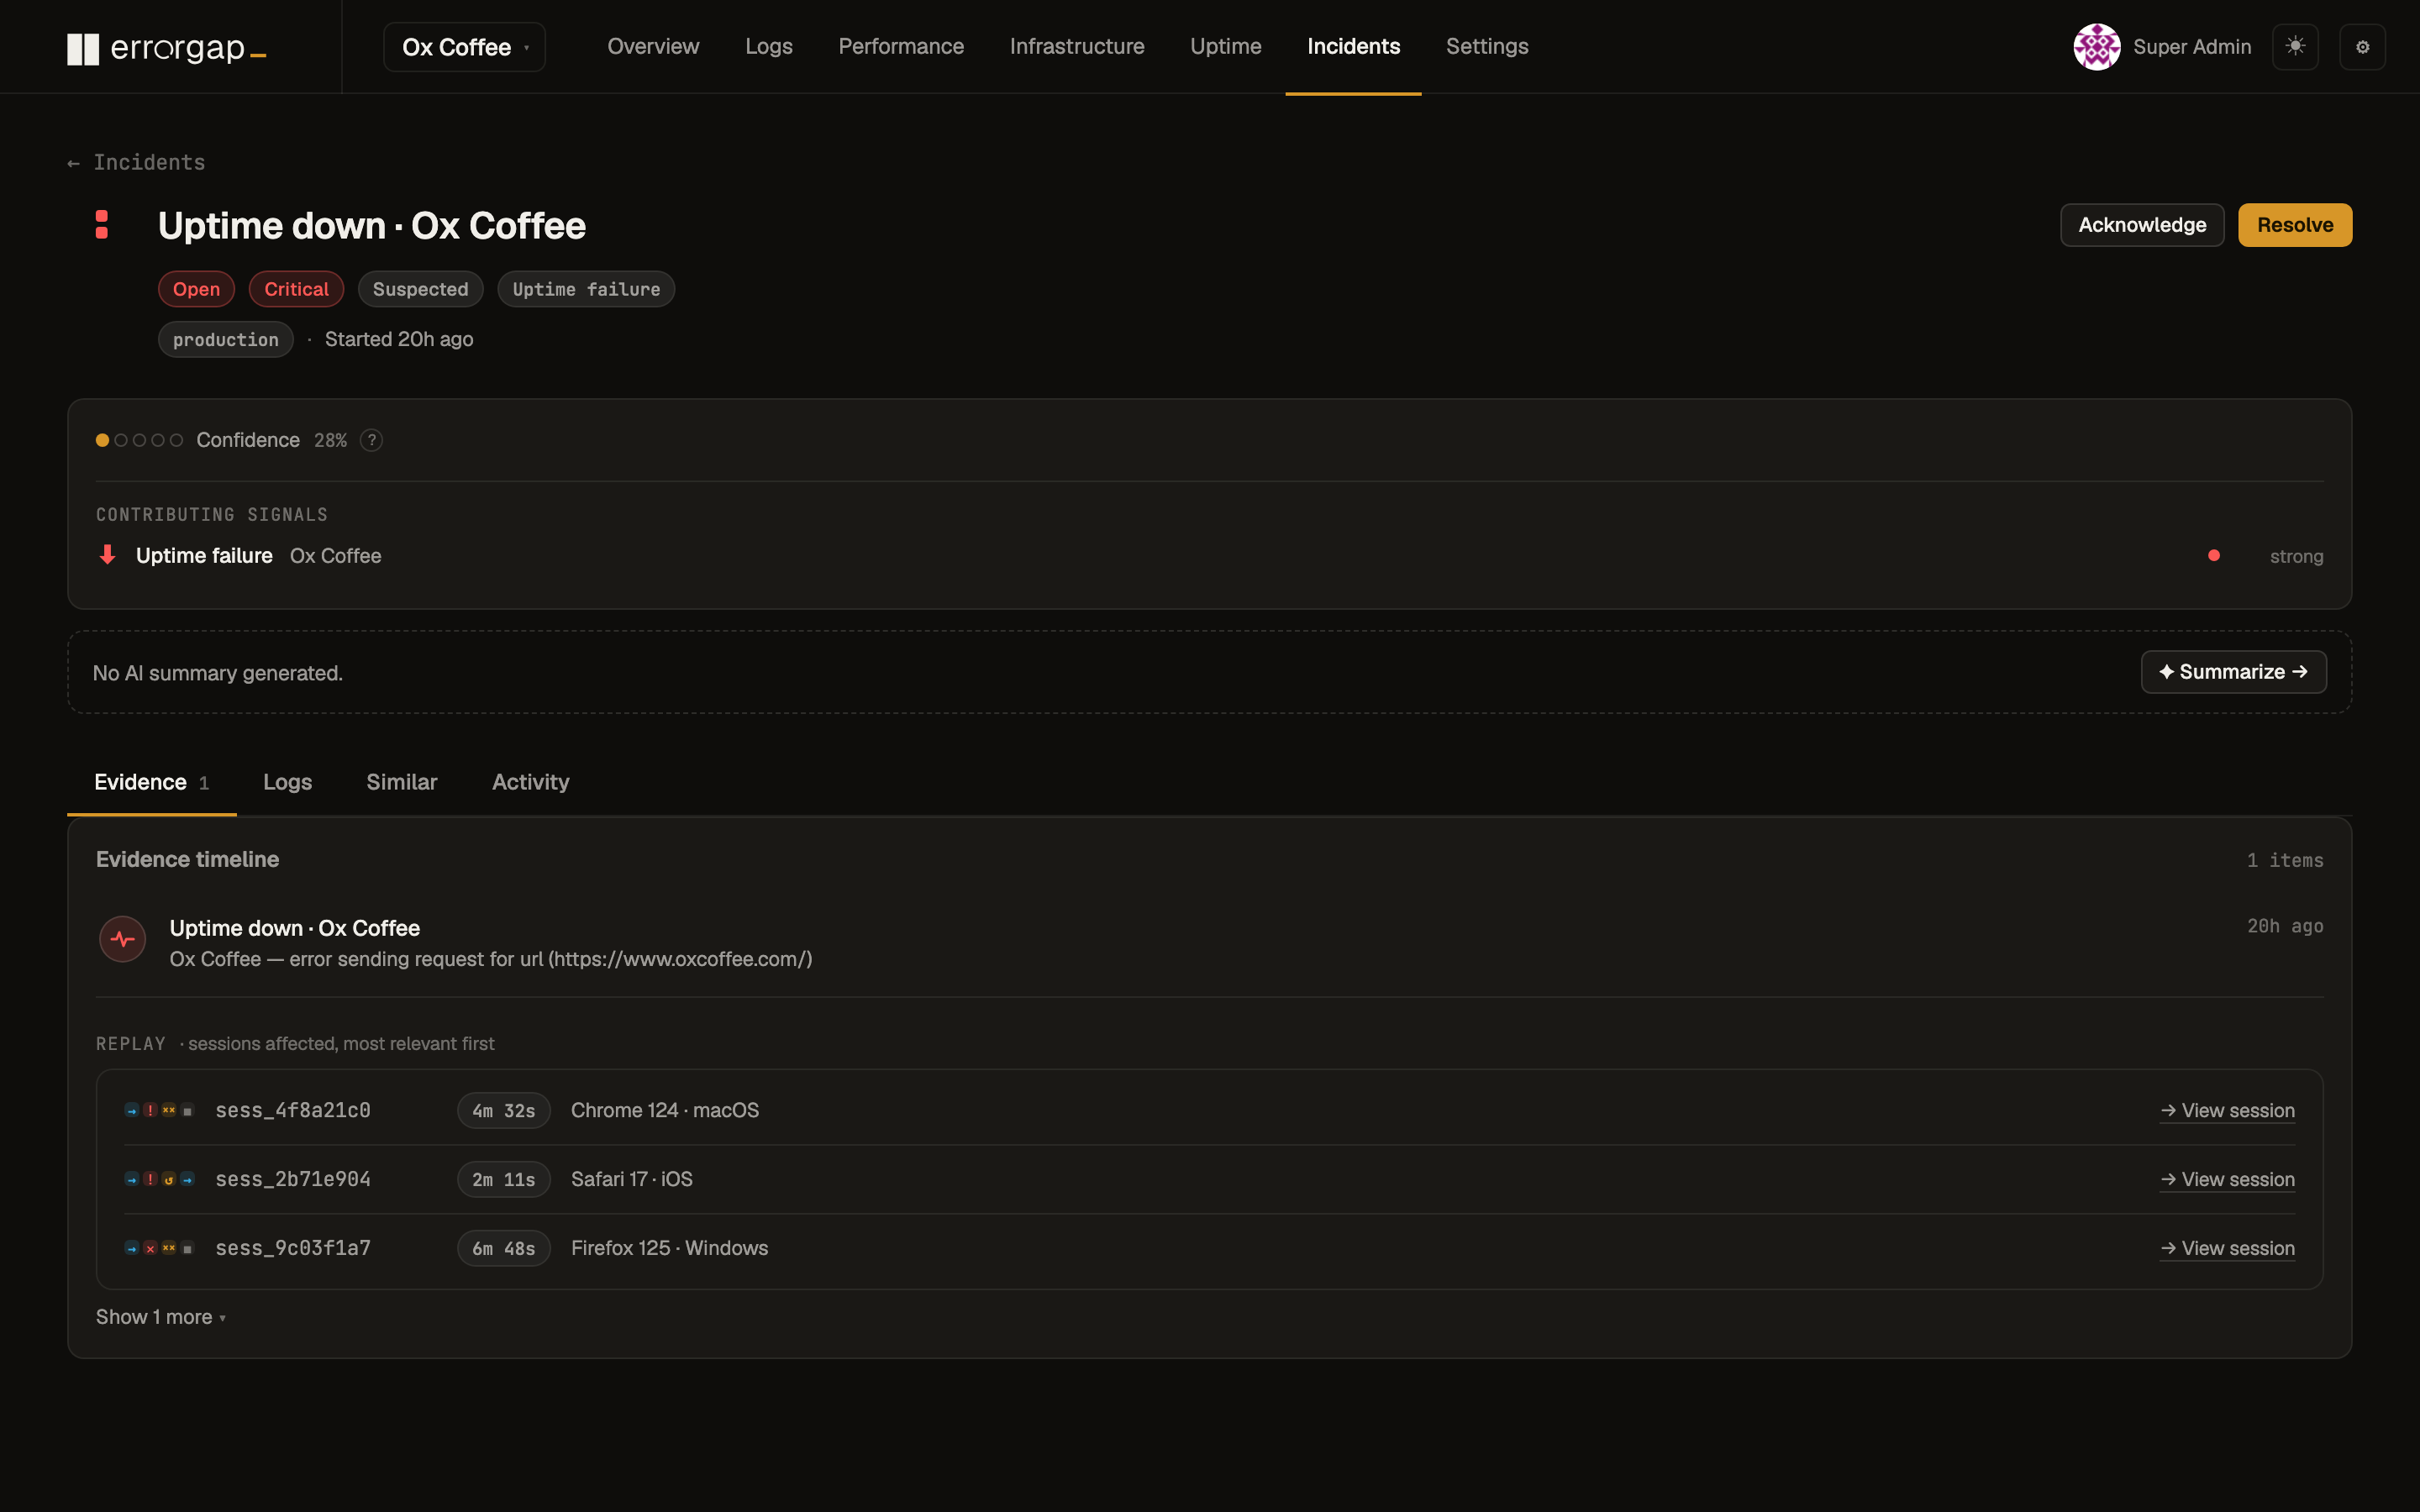
When signals become an incident.
Errorgap's heuristic engine watches for six trigger conditions and assembles the evidence into one Incident object — instead of leaving it scattered across separate views.
One object. All the evidence.
High-volume error groups, uptime failures, error-rate spikes, latency anomalies, infrastructure saturation, and deploy correlations — when a condition fires, it becomes a first-class incident with a full evidence trail.
- Six heuristics, evaluated on a 60-second cycle
- Evidence timeline: error groups, releases, uptime checks, APM traces
- Open → Acknowledged → Resolved lifecycle
- Manual incidents for what the heuristics don't catch
From signals to a likely cause, automatically.
The deterministic correlation panel runs the moment evidence loads — no configuration, no AI credit cost. It derives a likely cause, scores confidence, and surfaces the signals behind it. When you want prose, hit Summarize.
A confidence score, not a guess.
Backtrace overlap, similar prior incidents, and time correlation feed a weighted confidence score from 10–90% — with the contributing signals shown. The AI summary is explicitly triggered, never automatic.
- Backtrace overlap, similar incidents, time correlation
- Confidence scored 10–90% with signal weights shown
- Optional AI summary — explicit trigger, never automatic
- MCP tools: explain_incident, find_likely_cause, propose_fix
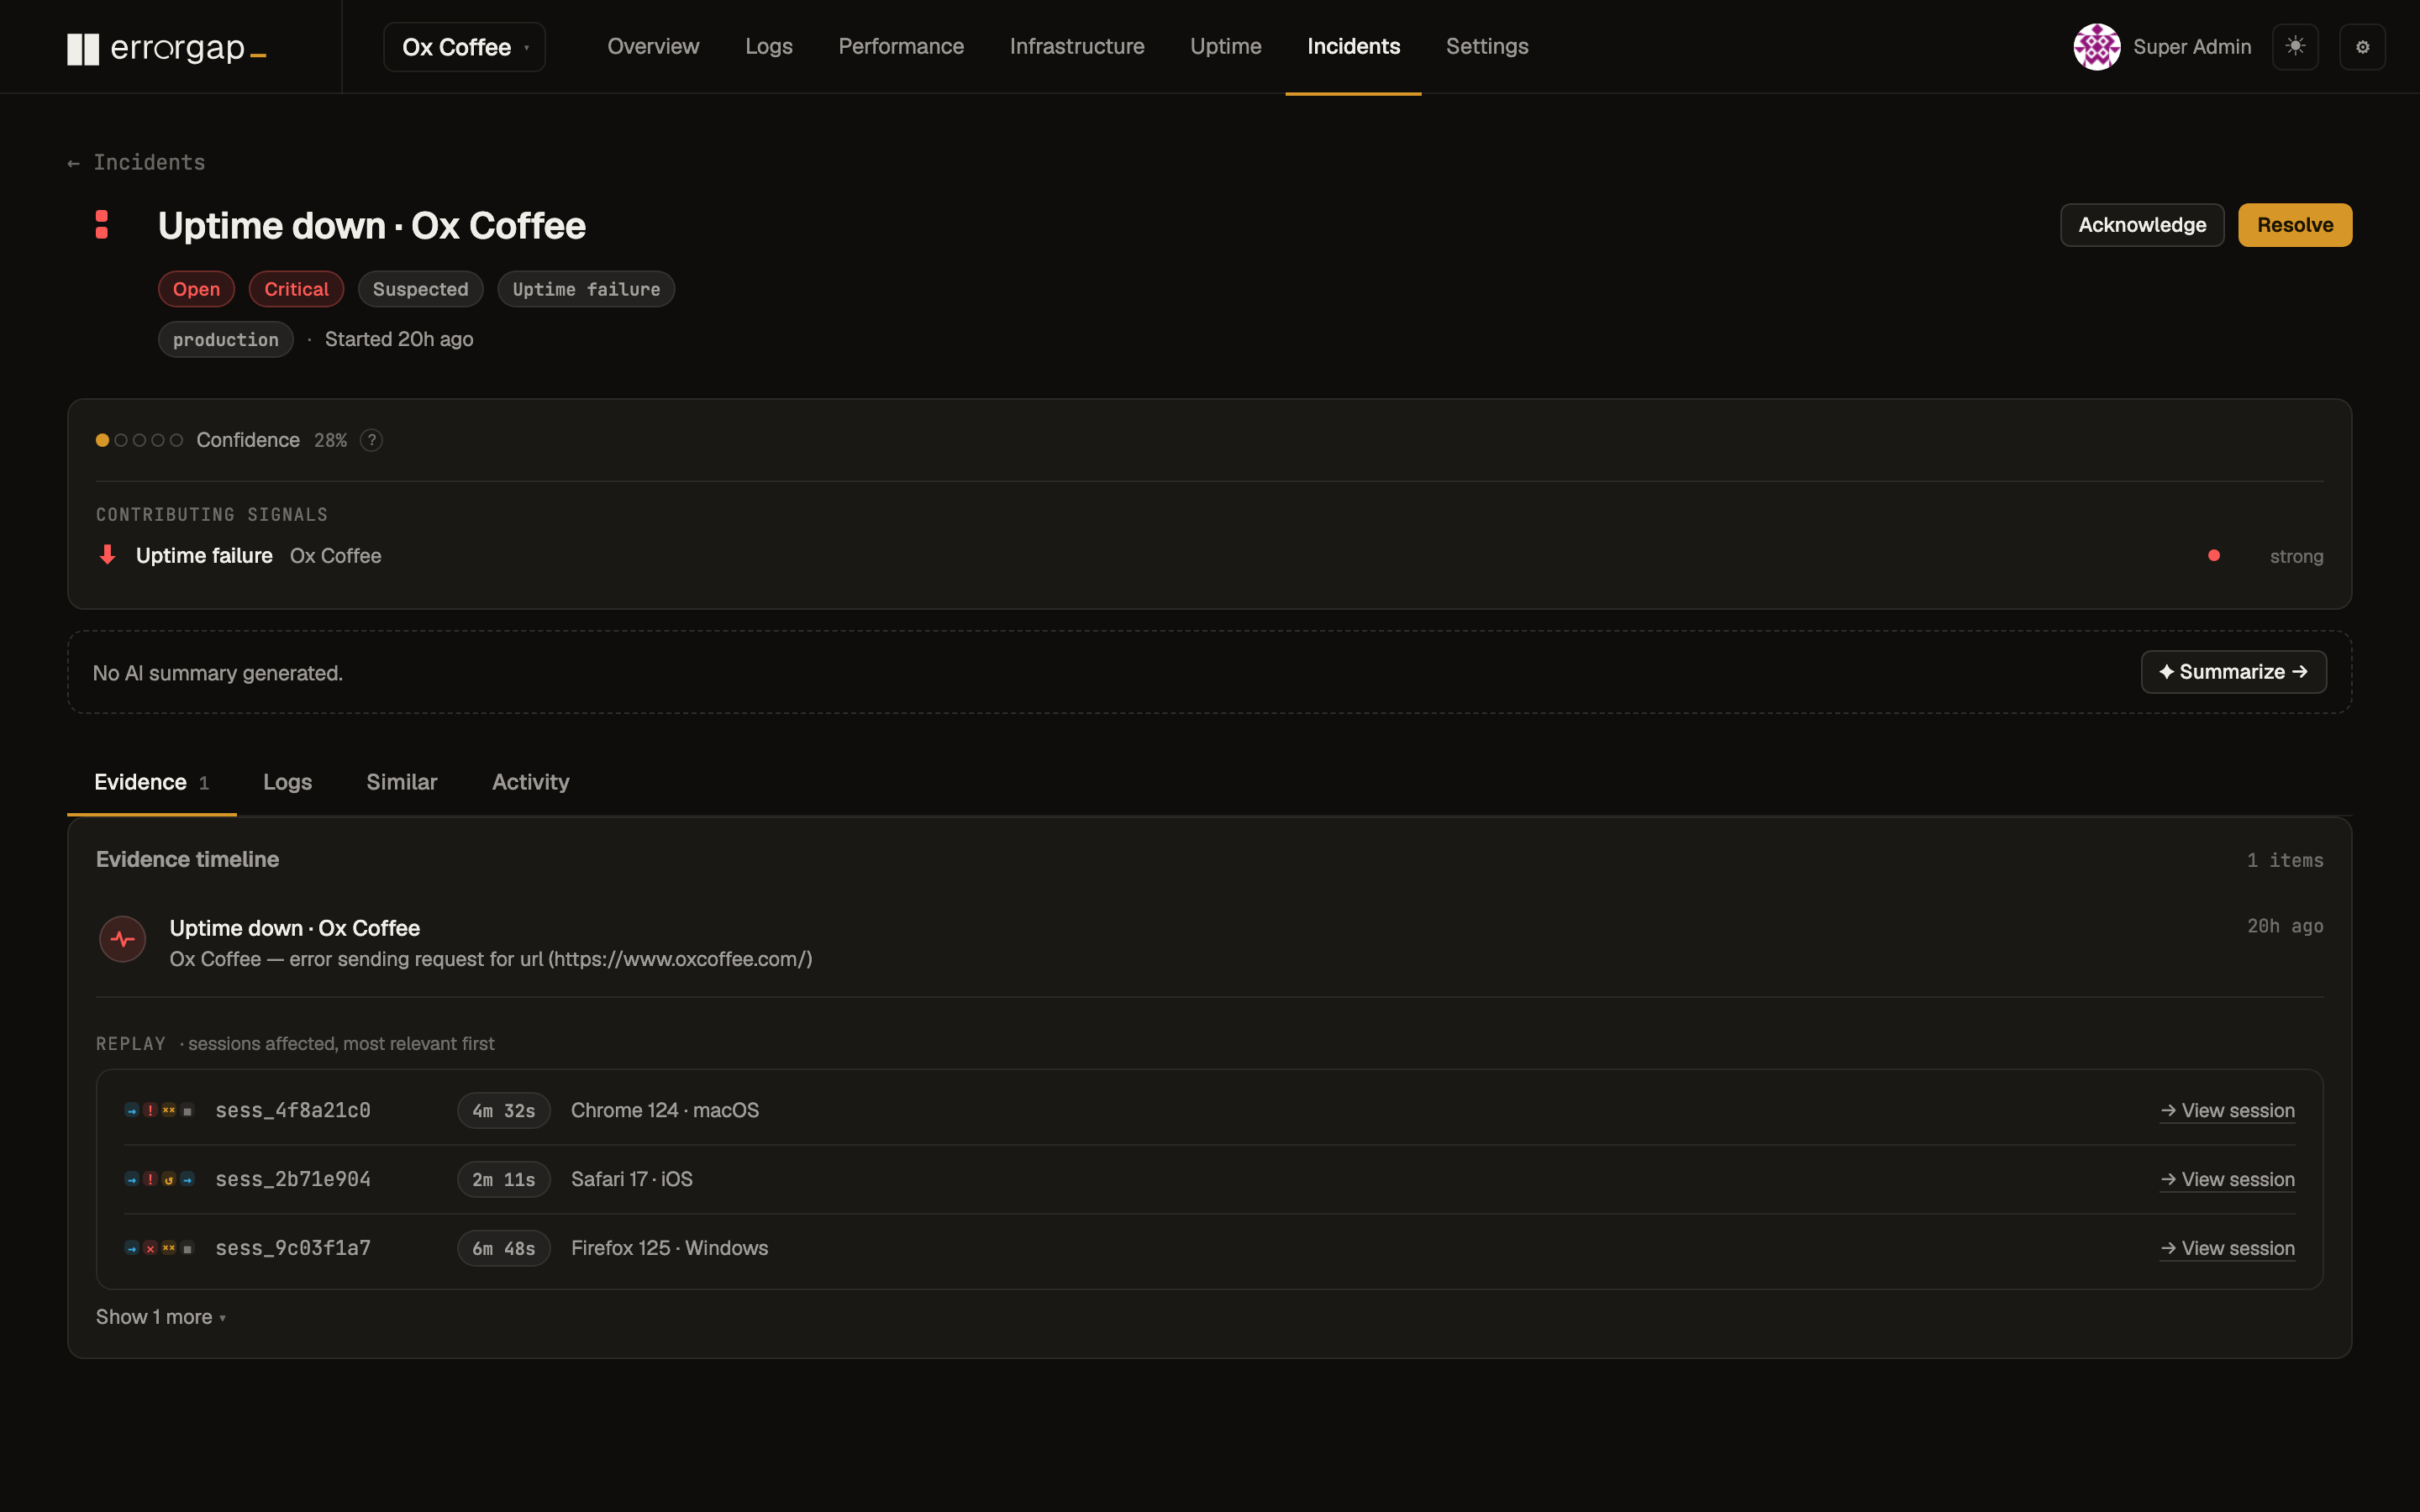
Every signal, framed in context.
No screenshot pasting, no log-file digging. Errorgap connects the exception to the line, the line to the deploy, and the deploy to the person who can fix it — then watches availability and latency alongside.
The line. The frame. The fix.
Every captured exception lands you on the offending source line with surrounding context and the full call stack. Same-signature errors collapse into one group with an occurrence count, sparkline, and the releases that triggered it.
- Source maps for JS/TS, debug symbols for Go & Java
- App / vendor / external frame filters
- Fingerprint grouping, merge/split, regression detection
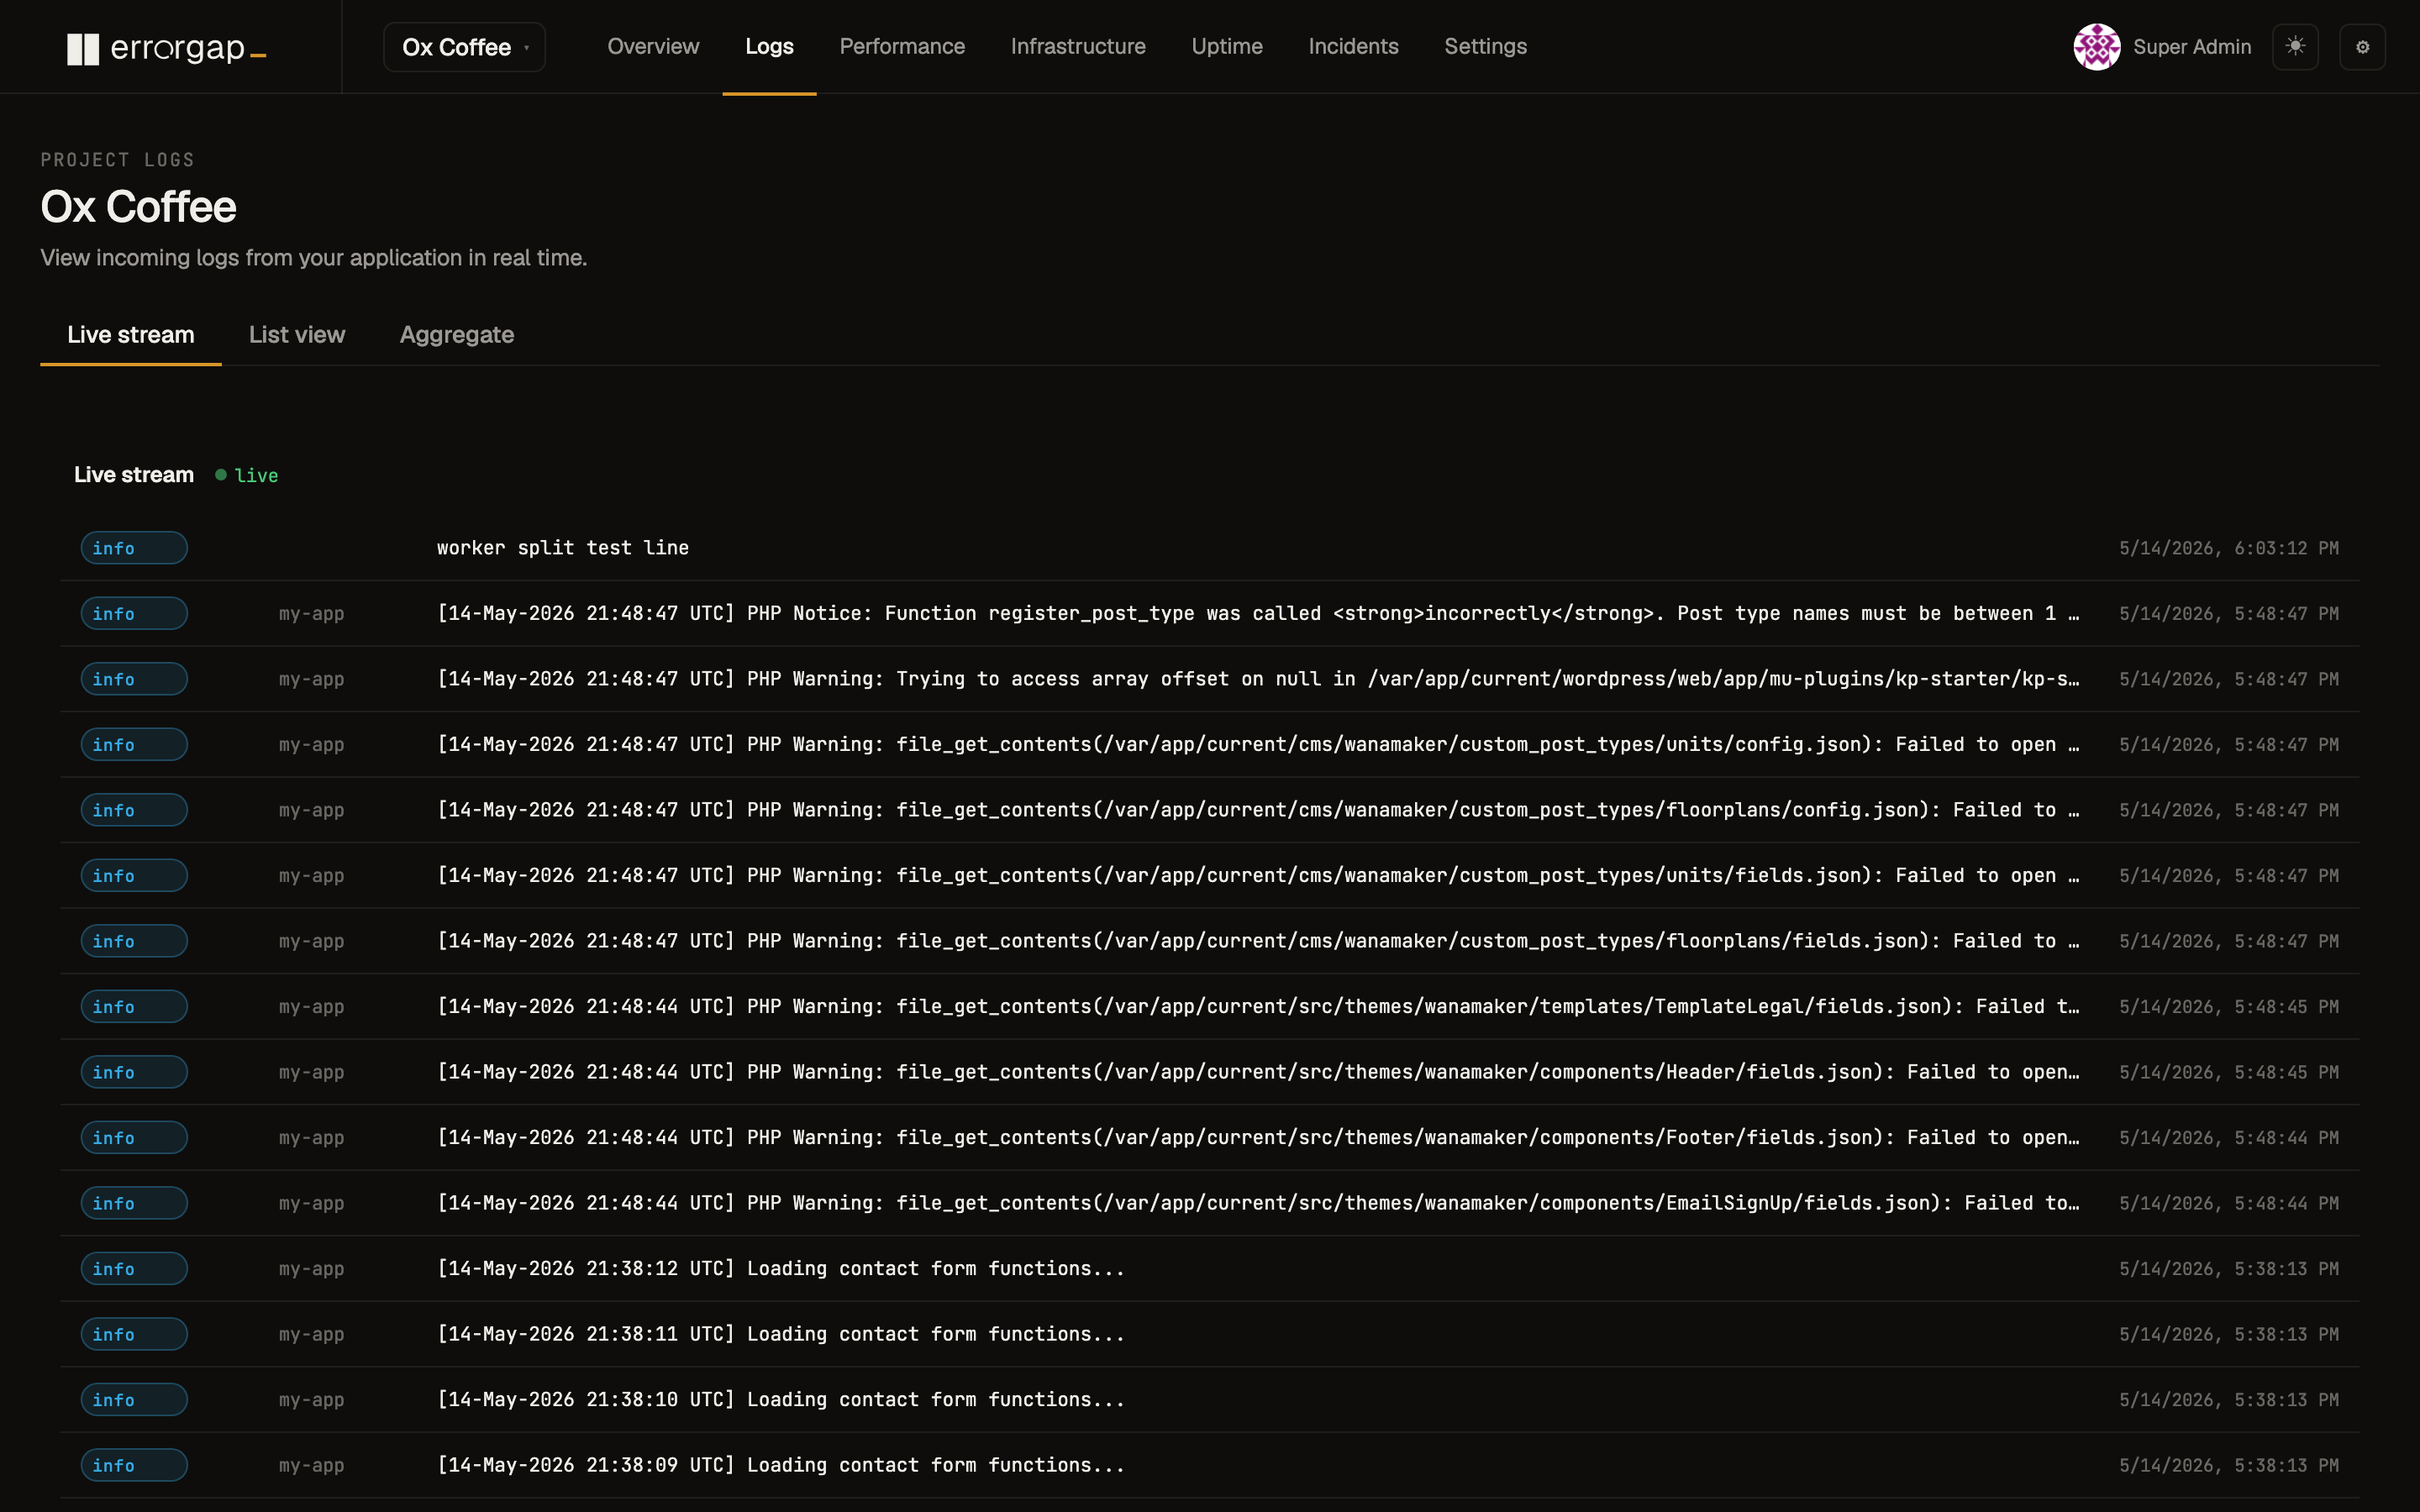
Watch your production breathe.
Stream errors, warnings, and structured logs straight from your runtime. Filter by level, source, or release — pause the stream, scrub backward, scrub forward.
- Live stream, sub-second latency
- Per-environment views (production / staging / dev)
- Aggregate view for capacity planning
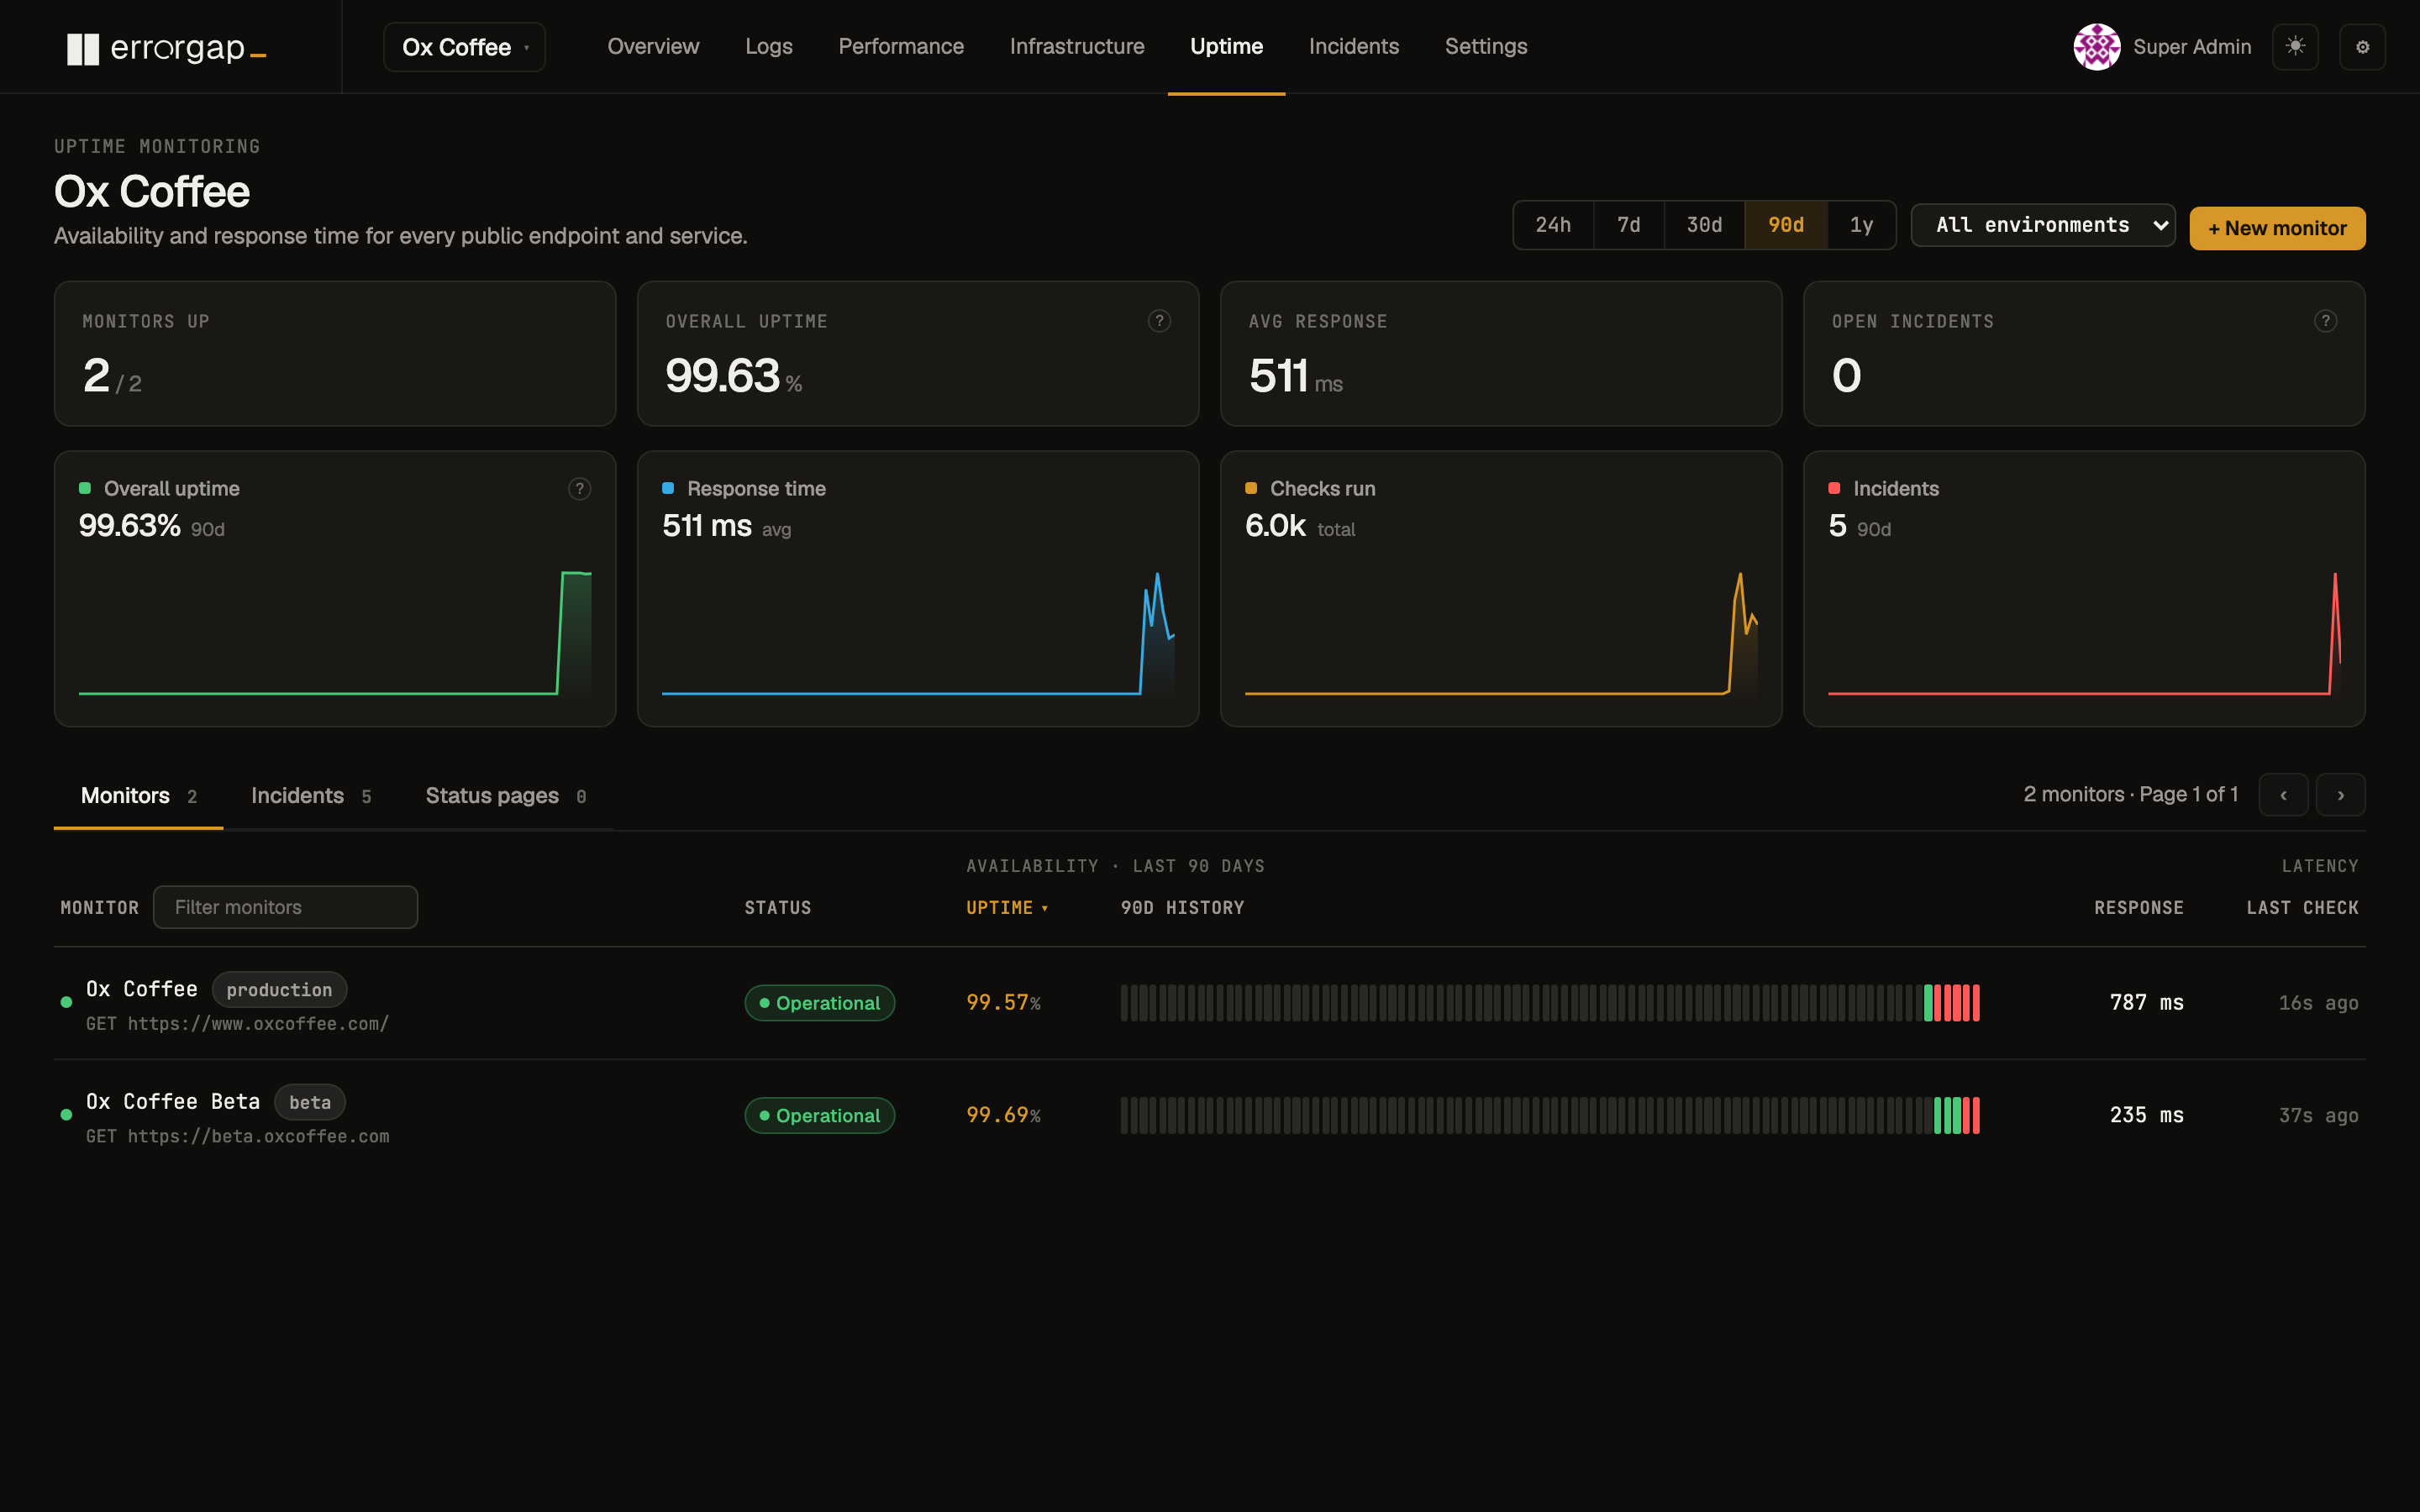
Know when your users can't reach you.
HTTP, TCP, and ping checks sweep on configurable intervals. Status changes open incidents automatically, and the 90-day availability timeline shows every degraded window in context.
- HTTP / TCP / ping · configurable intervals
- SSL certificate expiry monitoring
- Uptime incidents feed the Incident engine
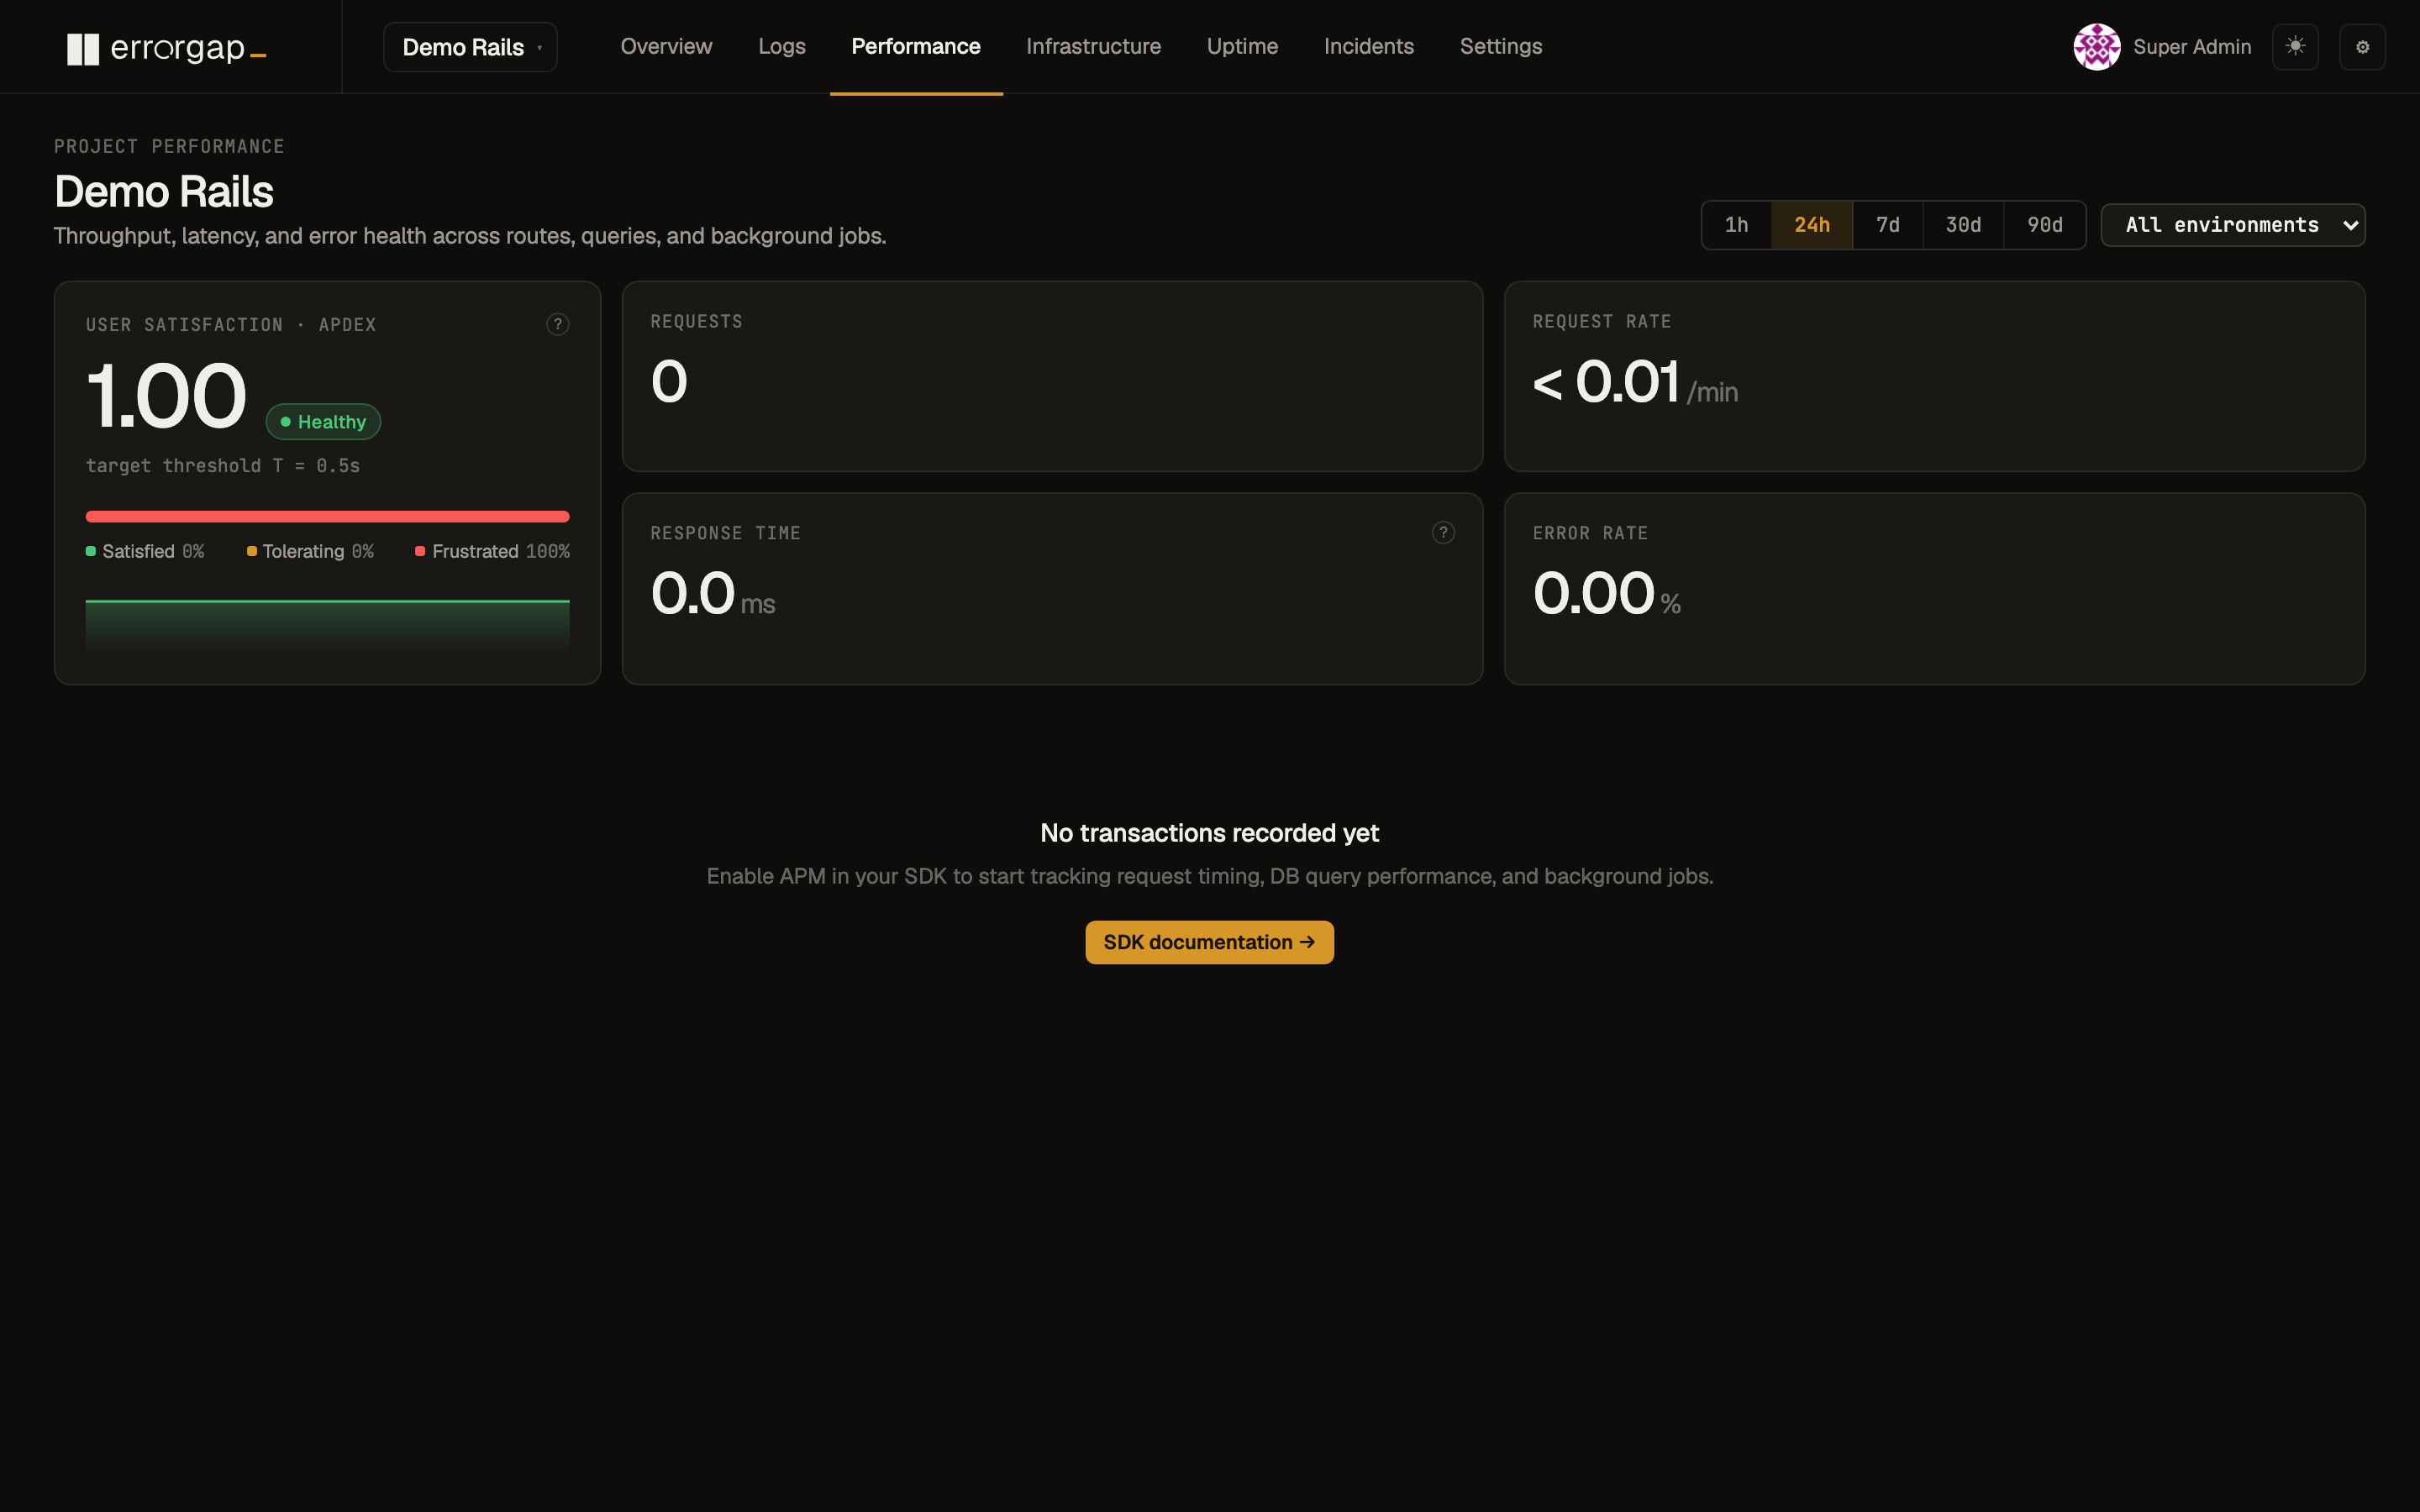
Slow routes surface before users file tickets.
Transaction timing from every web request and background job. Throughput, p95 latency, error rate, and DB time — with an Apdex score that tells you how users actually feel.
- Web requests and background jobs, side by side
- Apdex satisfaction with configurable threshold
- Latency anomalies feed the Incident engine
The session behind the failure.
Browser session timelines attach to incidents as evidence — DOM snapshots at the moment of failure, ranked most-relevant first.
- Rage clicks, dead clicks, error events
- Most-relevant sessions surfaced per incident
CPU, memory, disk — per host.
Fleet-wide CPU, memory, and disk health with per-host, per-volume, and per-process breakdowns across every cluster.
- Hosts, volumes, and processes views
- Saturation signals feed the Incident engine
Tie every error to a release.
Record releases and Errorgap surfaces the first affected release for each error group — and correlates deploys with incidents.
- First-affected-release per error group
- Deploy correlation as an incident heuristic
Give your AI agents production context.
Errorgap exposes a Model Context Protocol server so Claude, Cursor, Copilot, and any MCP-compatible agent can query live production data — error groups, incidents, backtraces, uptime status, and proposed fixes — without exposing your browser session.
{
  "mcpServers": {
    "errorgap": {
      "url": "https://app.errorgap.com/mcp",
      "headers": {
        "Authorization": "Bearer egmcp_…"
      },
      "scopes": ["errors:read", "logs:read", "source:read"]
    }
  }
}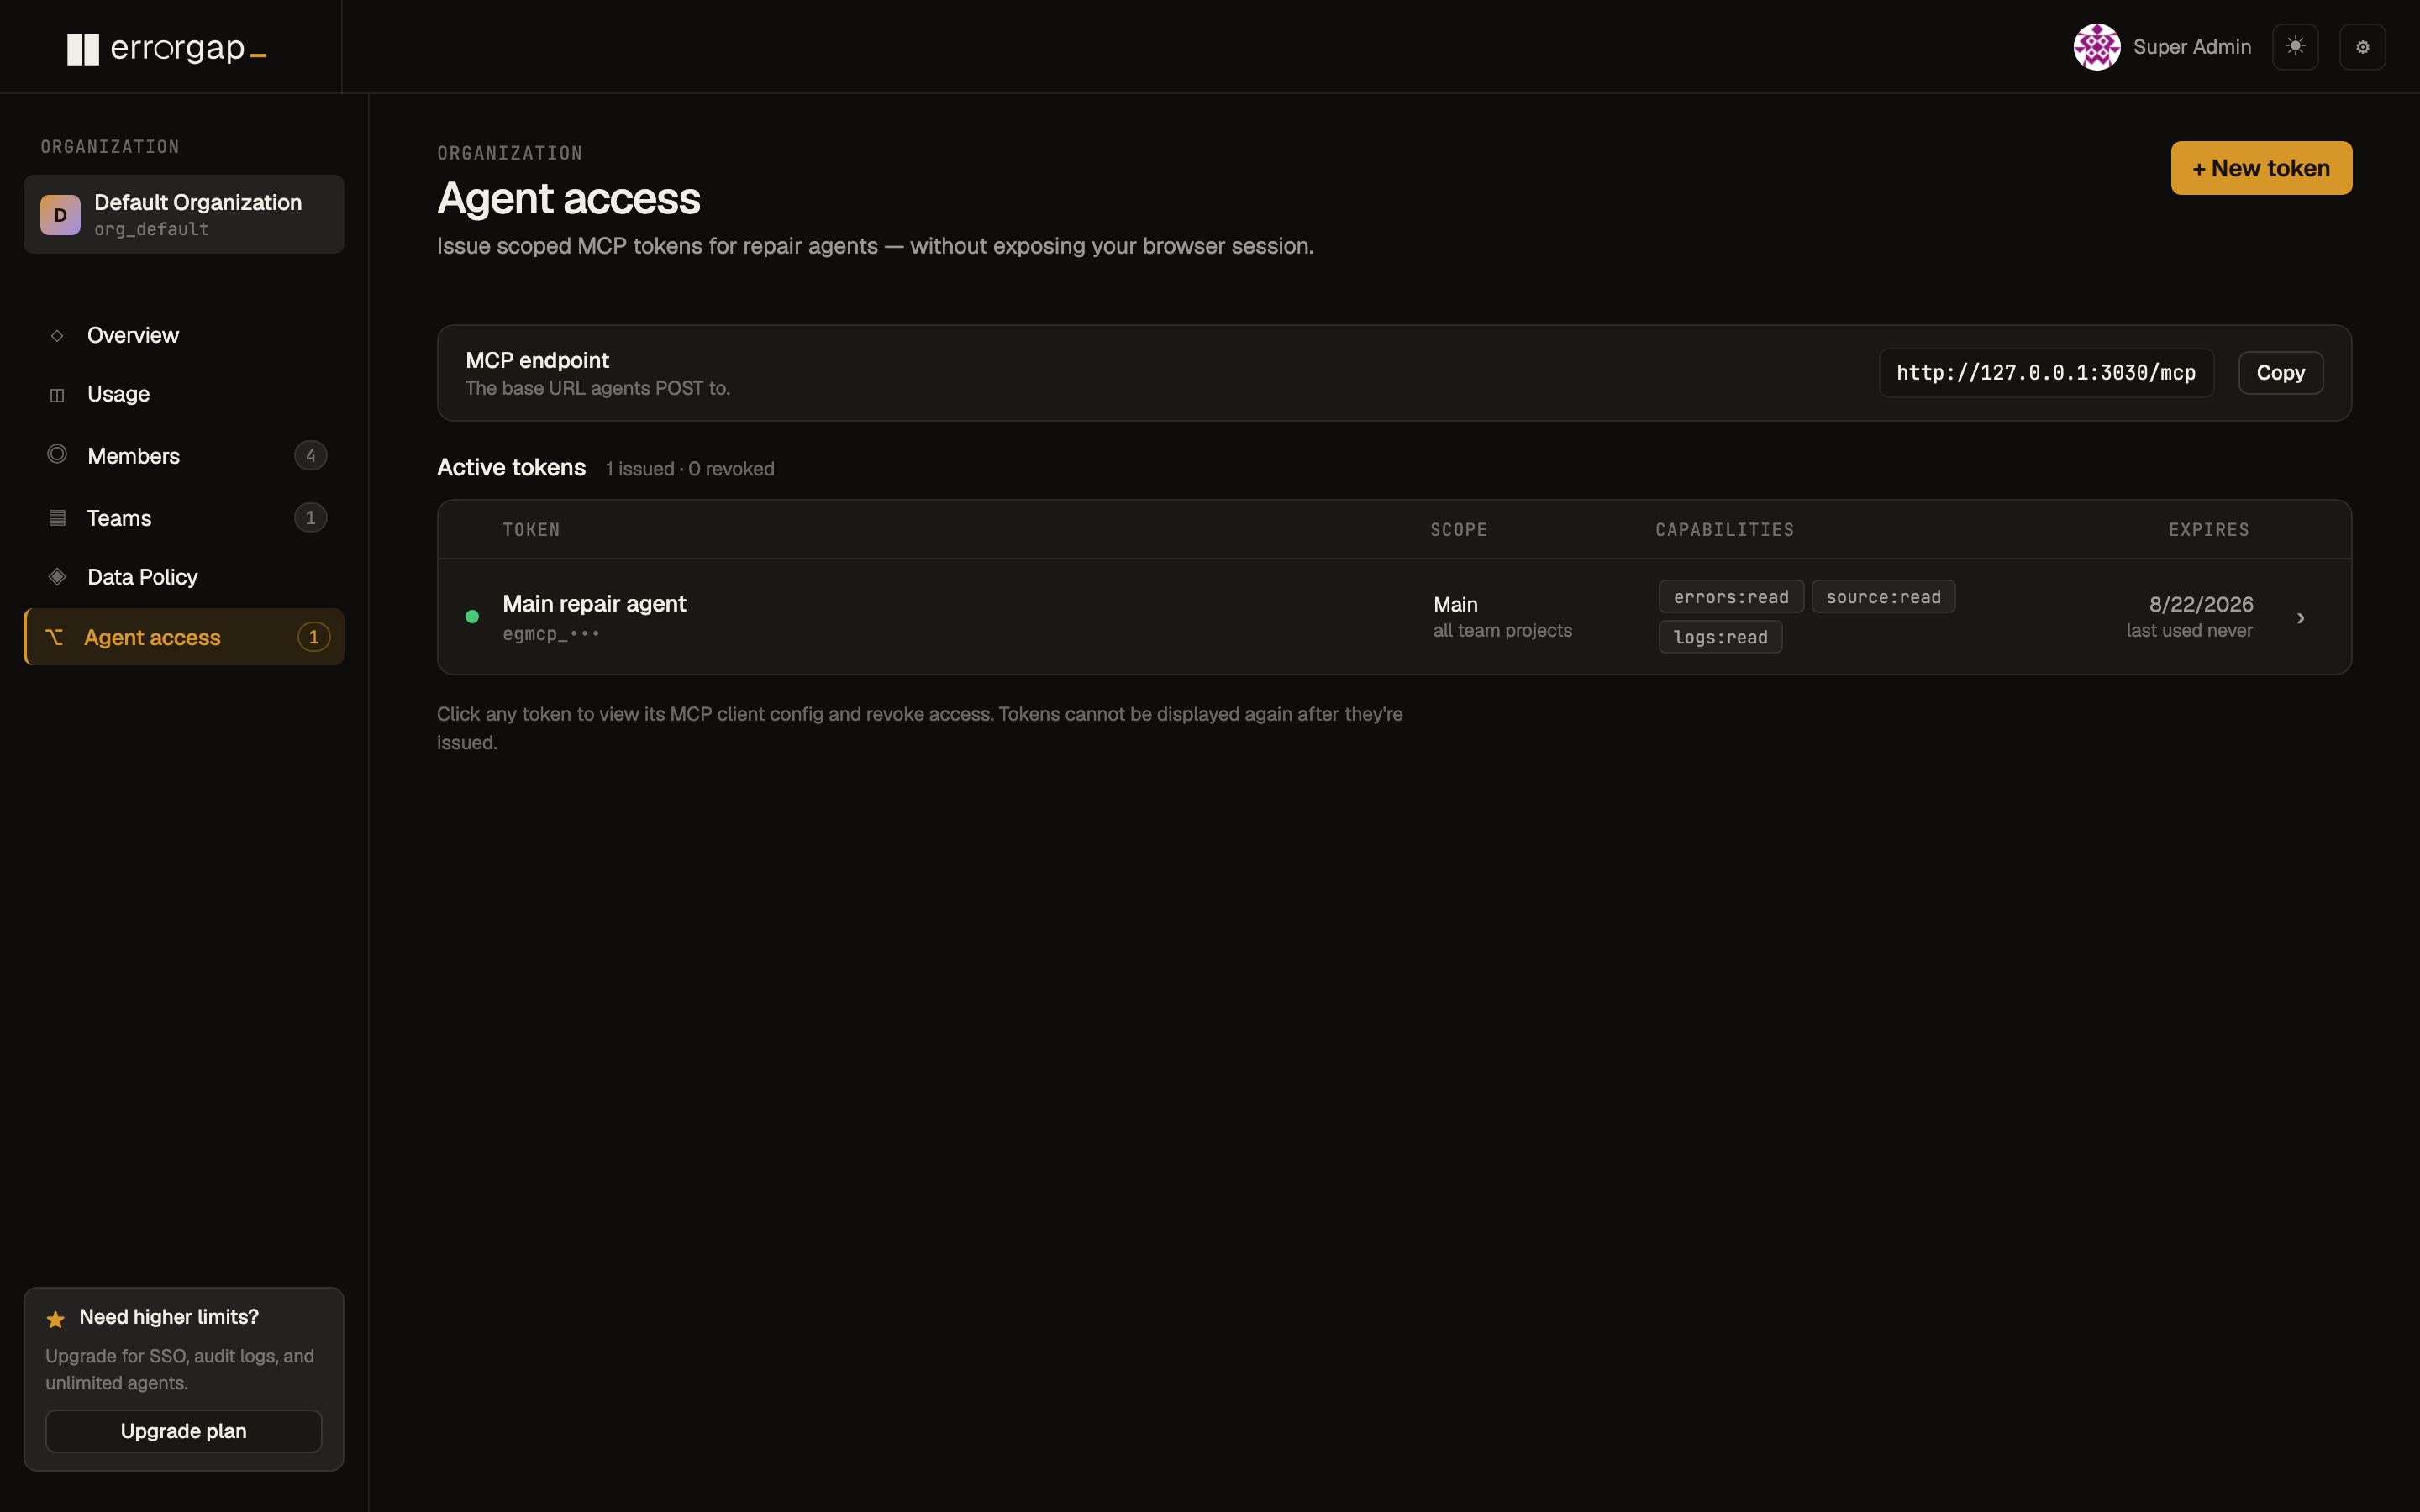
Scoped, redacted, per project.
- Tools: list/get errors, list/get incidents, explain incident, find likely cause, propose fix
- Per-project exposure toggles — six categories of data
- Org-level defaults with per-project overrides
- Regex-based redaction rules with live preview
- Scoped API keys, revocable from the Agent Access page
Three lines and you're shipping.
Pick your runtime. The SDK does the rest — async-safe, fork-safe, and zero overhead in dev.
Wired into the tools you already use.
Errorgap doesn't try to replace your issue tracker or your chat. It connects to them and stays out of the way.
Per-event pricing. No seat tax.
Pay for what you capture, not who's logged in. Every plan includes every feature except the bits genuinely tied to enterprise compliance.
- 7-day retention
- 1 project
- 200 replays · 1 uptime monitor
- Email alerts
- AI investigation
- SSO
- Audit log
- 30-day retention
- Unlimited projects
- 5k replays · 10 uptime monitors
- AI investigation
- Slack + GitHub
- SSO
- Audit log
- 90-day retention
- 25k replays · 50 uptime monitors
- SSO · SAML
- Audit log
- Priority support · 4h SLA
- Dedicated infrastructure
- Custom data residency
- Custom SLA
- Security review
- Solutions architect